Saudi football chief Yasser Al-Misehal resigns after World Cup group stage exit
Al-Misehal's resignation highlights the challenges Saudi Arabia faces in aligning its football ambitions with Vision 2030's broader goals. The post Saudi football…
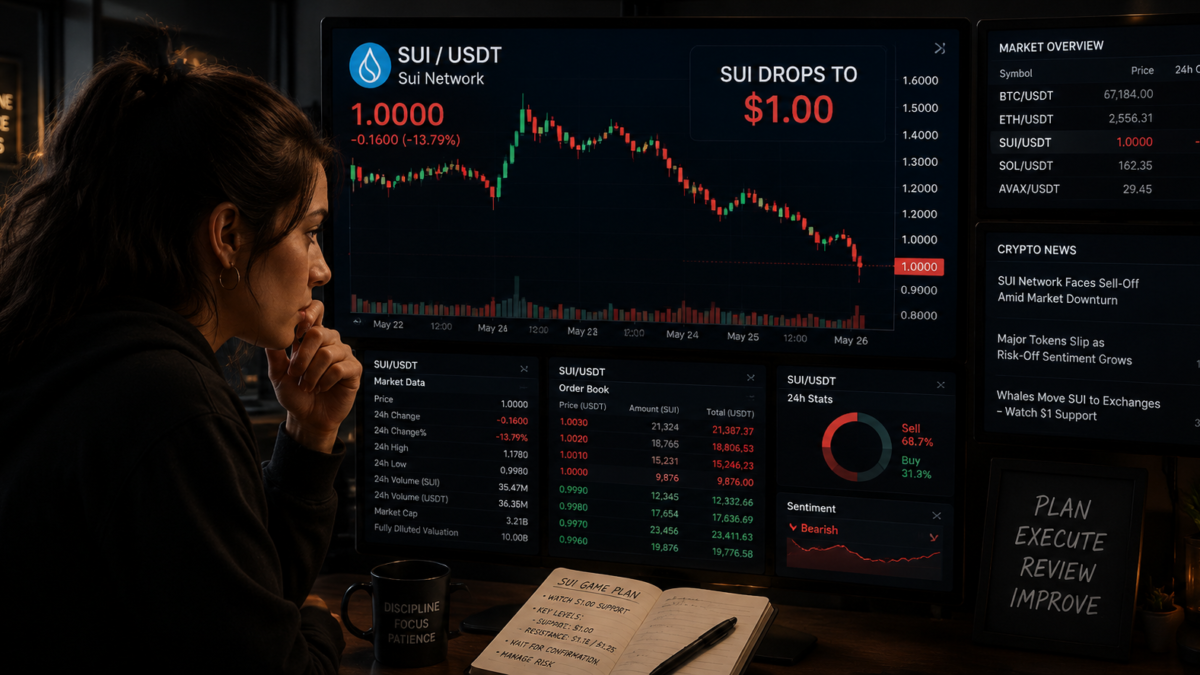
Key takeaways Sui is down 10% on Friday, extending its decline for the fifth consecutive day. The technical outlook for SUI is bearish, with a risk of a steeper decline…
Key takeaways
Sui (SUI) is down roughly 10% on Friday, continuing a five-day decline this week as retail interest in the token wanes.
The broader market is shifting focus away from underperforming layer-1 assets, and technical indicators suggest a potential double-digit drop toward $1.00.
SUI is also losing traction in the derivatives market. According to CoinGlass, SUI futures Open Interest (OI) fell 10.5% over the past 24 hours to $727.97 million, reflecting a reduced notional value of outstanding contracts.
In the same period, $7.2 million in positions were liquidated, with $7. million coming from long positions—indicating strong sell-side pressure.
The SUI/USD 4H chart is bearish and efficient as Sui is down by 10% in the last 24 hours. At press time, SUI is trading below the 50-period Exponential Moving Average (EMA) at $1.1558 and the lower Bollinger Band at $1.1442, showing short-term bearish bias.
The token remains above the 200-period EMA at $1.0270, suggesting that the broader recovery structure is still intact despite waning momentum.
Momentum indicators indicate that the bears are still in play. The Relative Strength Index (RSI) has slipped to 46, below the midline, while the MACD histogram remains in negative territory, implying that rebounds may face persistent selling pressure.
If the bearish trend persists, the bulls would encounter the first support at the 200-day EMA at $1.0270 and the 78.6% Fibonacci retracement at $0.9972.
A daily close below this level could see SUI approach the prior cycle low near $0.8815.

However, if the bulls regain control, SUI could rally towards the first resistance level at $1.2171. An extended rally could see SUI hit the upper Bollinger Band near $1.2900, and the 23.6% Fibonacci retracement at $1.2947.
SUI’s technical structure shows deteriorating momentum, and traders should monitor both spot and derivatives markets for signs of further downside or potential relief rallies.
Al-Misehal's resignation highlights the challenges Saudi Arabia faces in aligning its football ambitions with Vision 2030's broader goals. The post Saudi football…

A new Chinese military study led by Gao Tianyun at the National University of Defense Technology in Nanjing describes how a U.S.…


One liquidity zone now stands between EIGEN and a stronger breakout.


The AI investment surge is a potential flashpoint for systemic risk, “as financing has relied on enormous debt and highly leveraged nonbank…