Trump Holds Up CBDC Ban Through 2030 as He Demands a Voter-ID Law
U.S. President Donald Trump is reportedly withholding his signature from a sweeping housing bill that would bar the Federal Reserve from issuing…

Bitcoin’s past July gains and heavy short bets point to a rally toward $75,000, but a break below key support keeps the risk of $55,000 in play.

![]()
![]() Written by Yashu Golastaff writerReviewed by Allen Scottstaff editor
Written by Yashu Golastaff writerReviewed by Allen Scottstaff editor![]() Written by Yashu Golastaff writer
Written by Yashu Golastaff writer![]() Reviewed by Allen Scottstaff editorWill Bitcoin price recover in July? MarketsPublishedJun 28, 2026<!–>
Reviewed by Allen Scottstaff editorWill Bitcoin price recover in July? MarketsPublishedJun 28, 2026<!–>
Bitcoin’s past July gains and heavy short bets point to a rally toward $75,000, but a break below key support keeps the risk of $55,000 in play.
 –>
–>
Bitcoin (BTC) is heading for its worst monthly loss since mid-2022, with BTC down roughly 18.5% in June as price struggles to hold the psychological $60,000 support level.
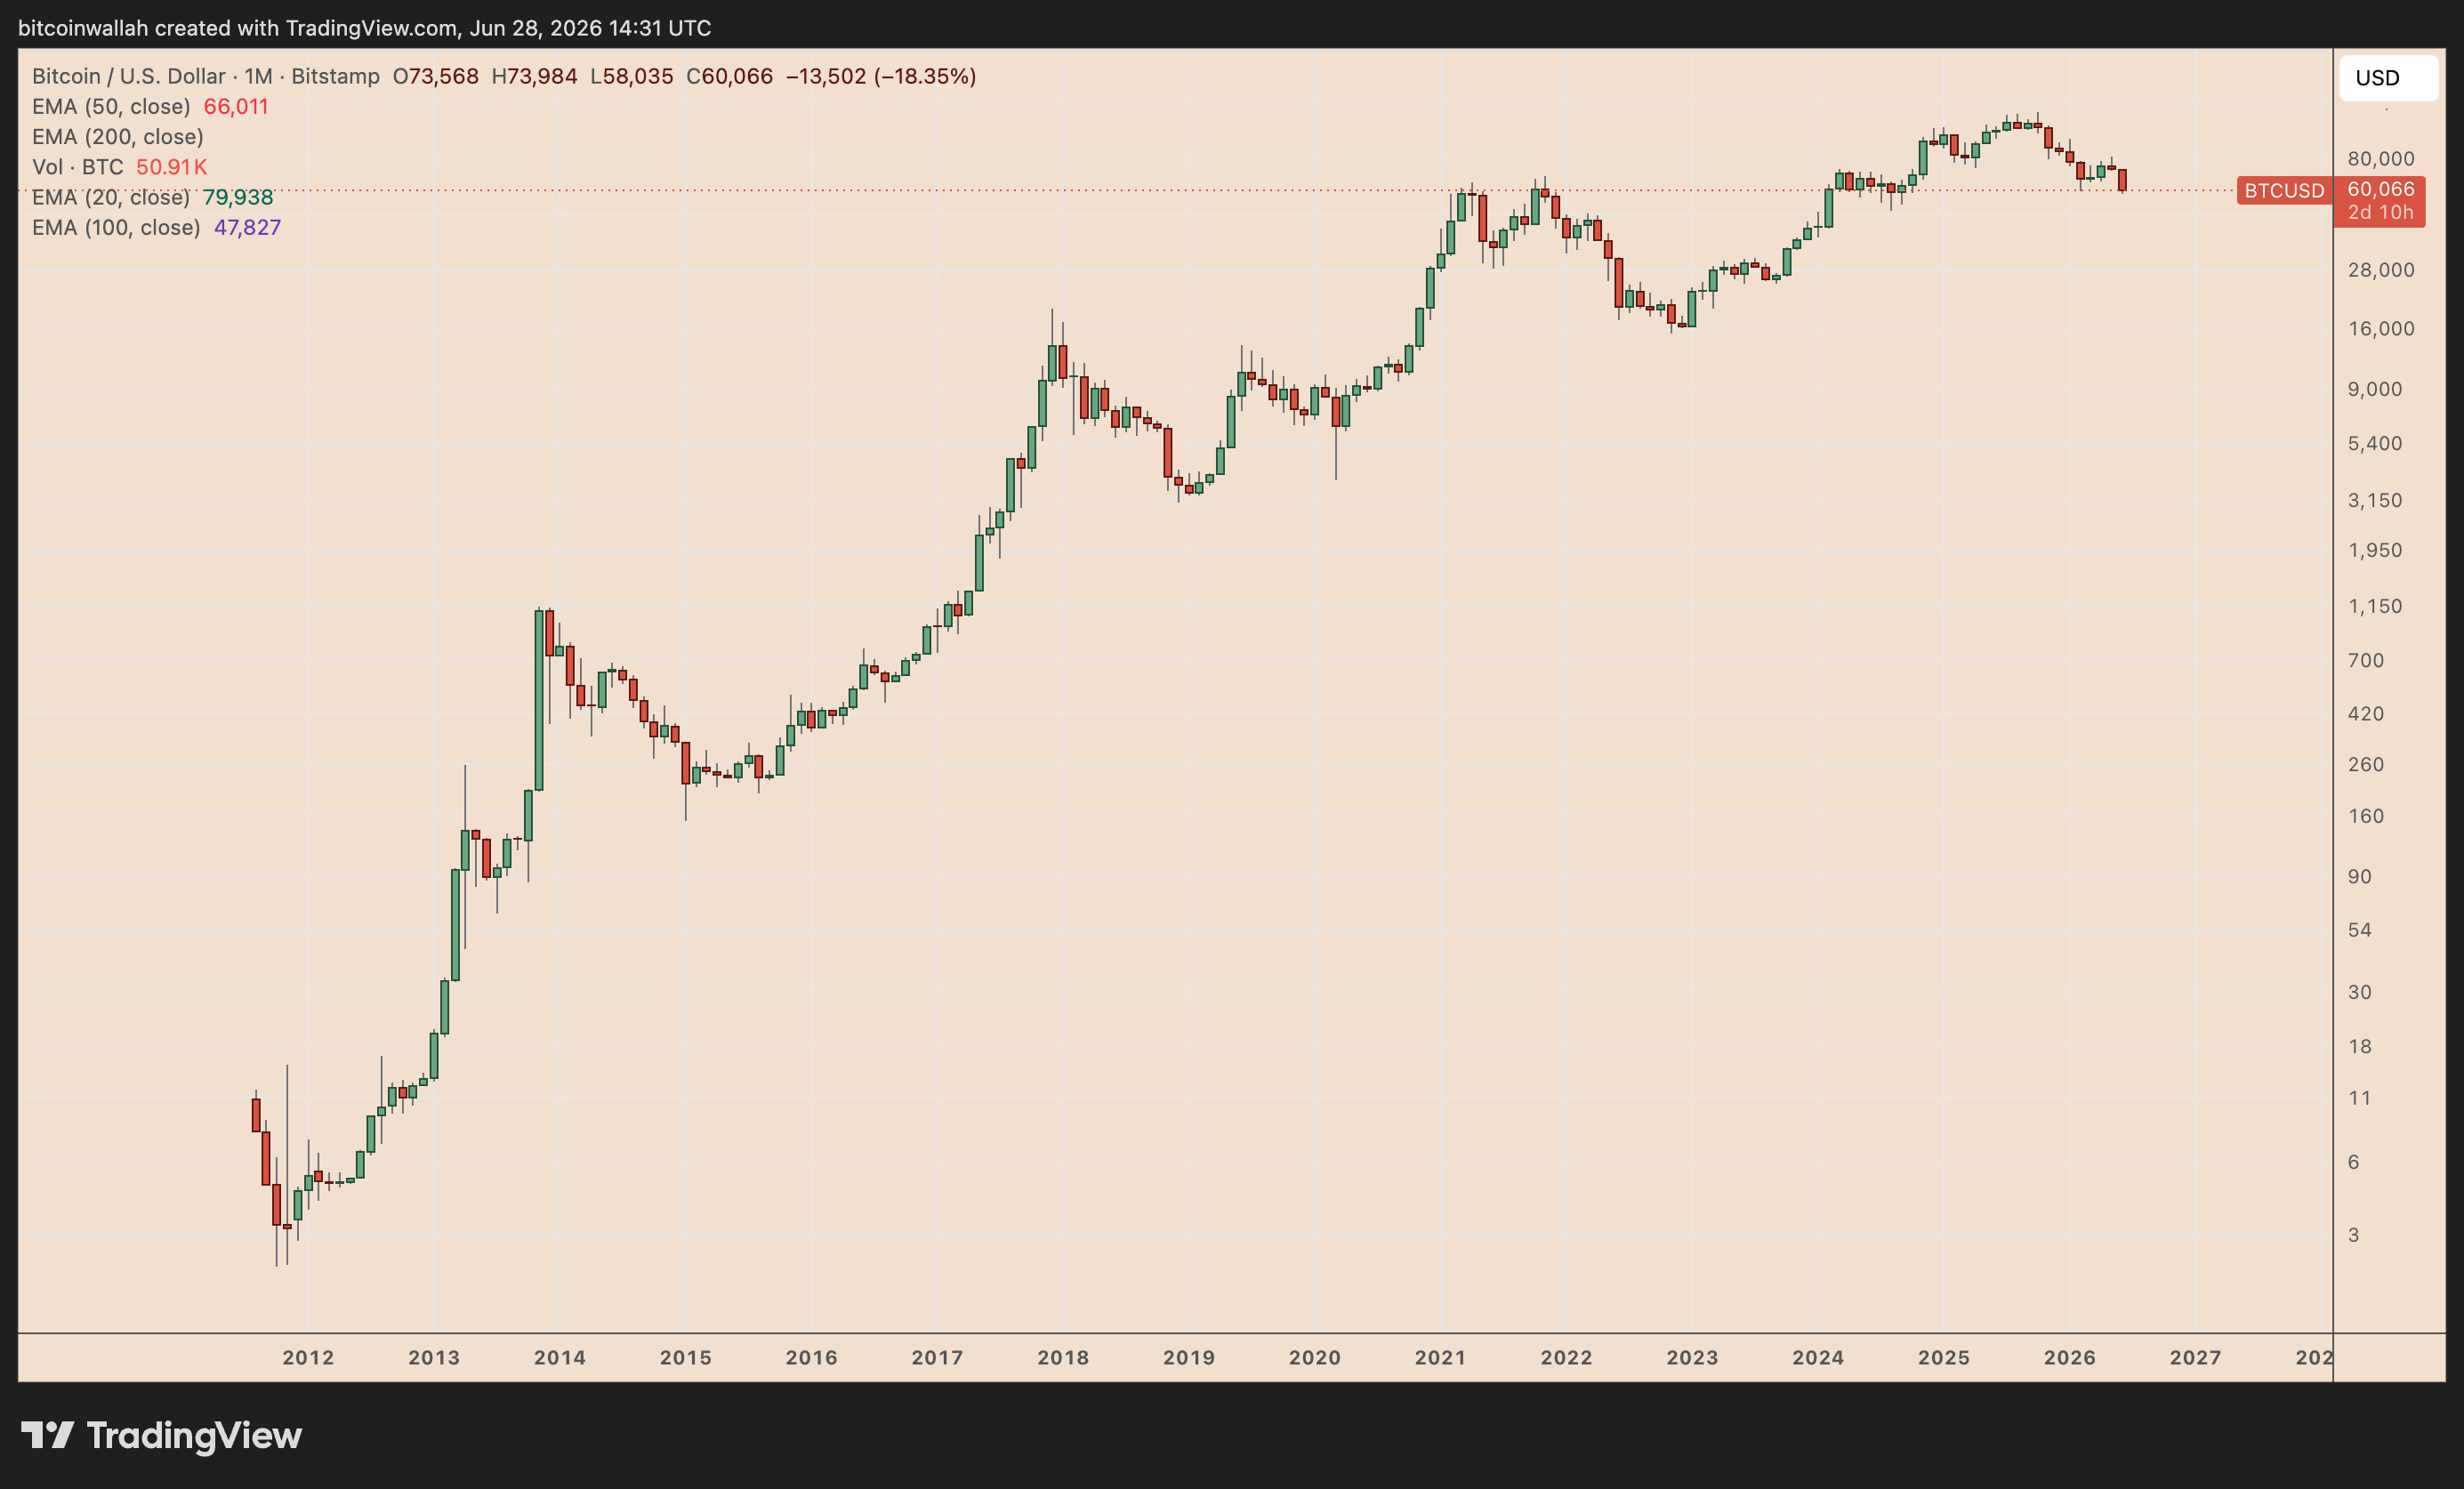
BTC/USD monthly chart. Source: TradingView
Will Bitcoin’s downside momentum extend in July, or is BTC preparing for a recovery?
Key takeaways:
July may become a “bullish month for Bitcoin,” according to analyst Fleh, who predicted BTC price to rally toward $75,000 next month.
The bullish thesis is based on Bitcoin’s Binance BTC/USDT liquidation heatmap, which shows a large concentration of short liquidation levels sitting above the current price.
On the monthly chart, the strongest visible liquidity cluster sits near $67,645, where the chart shows around $247.39 million in liquidation leverage and roughly $2.26 billion in cumulative short liquidation leverage.
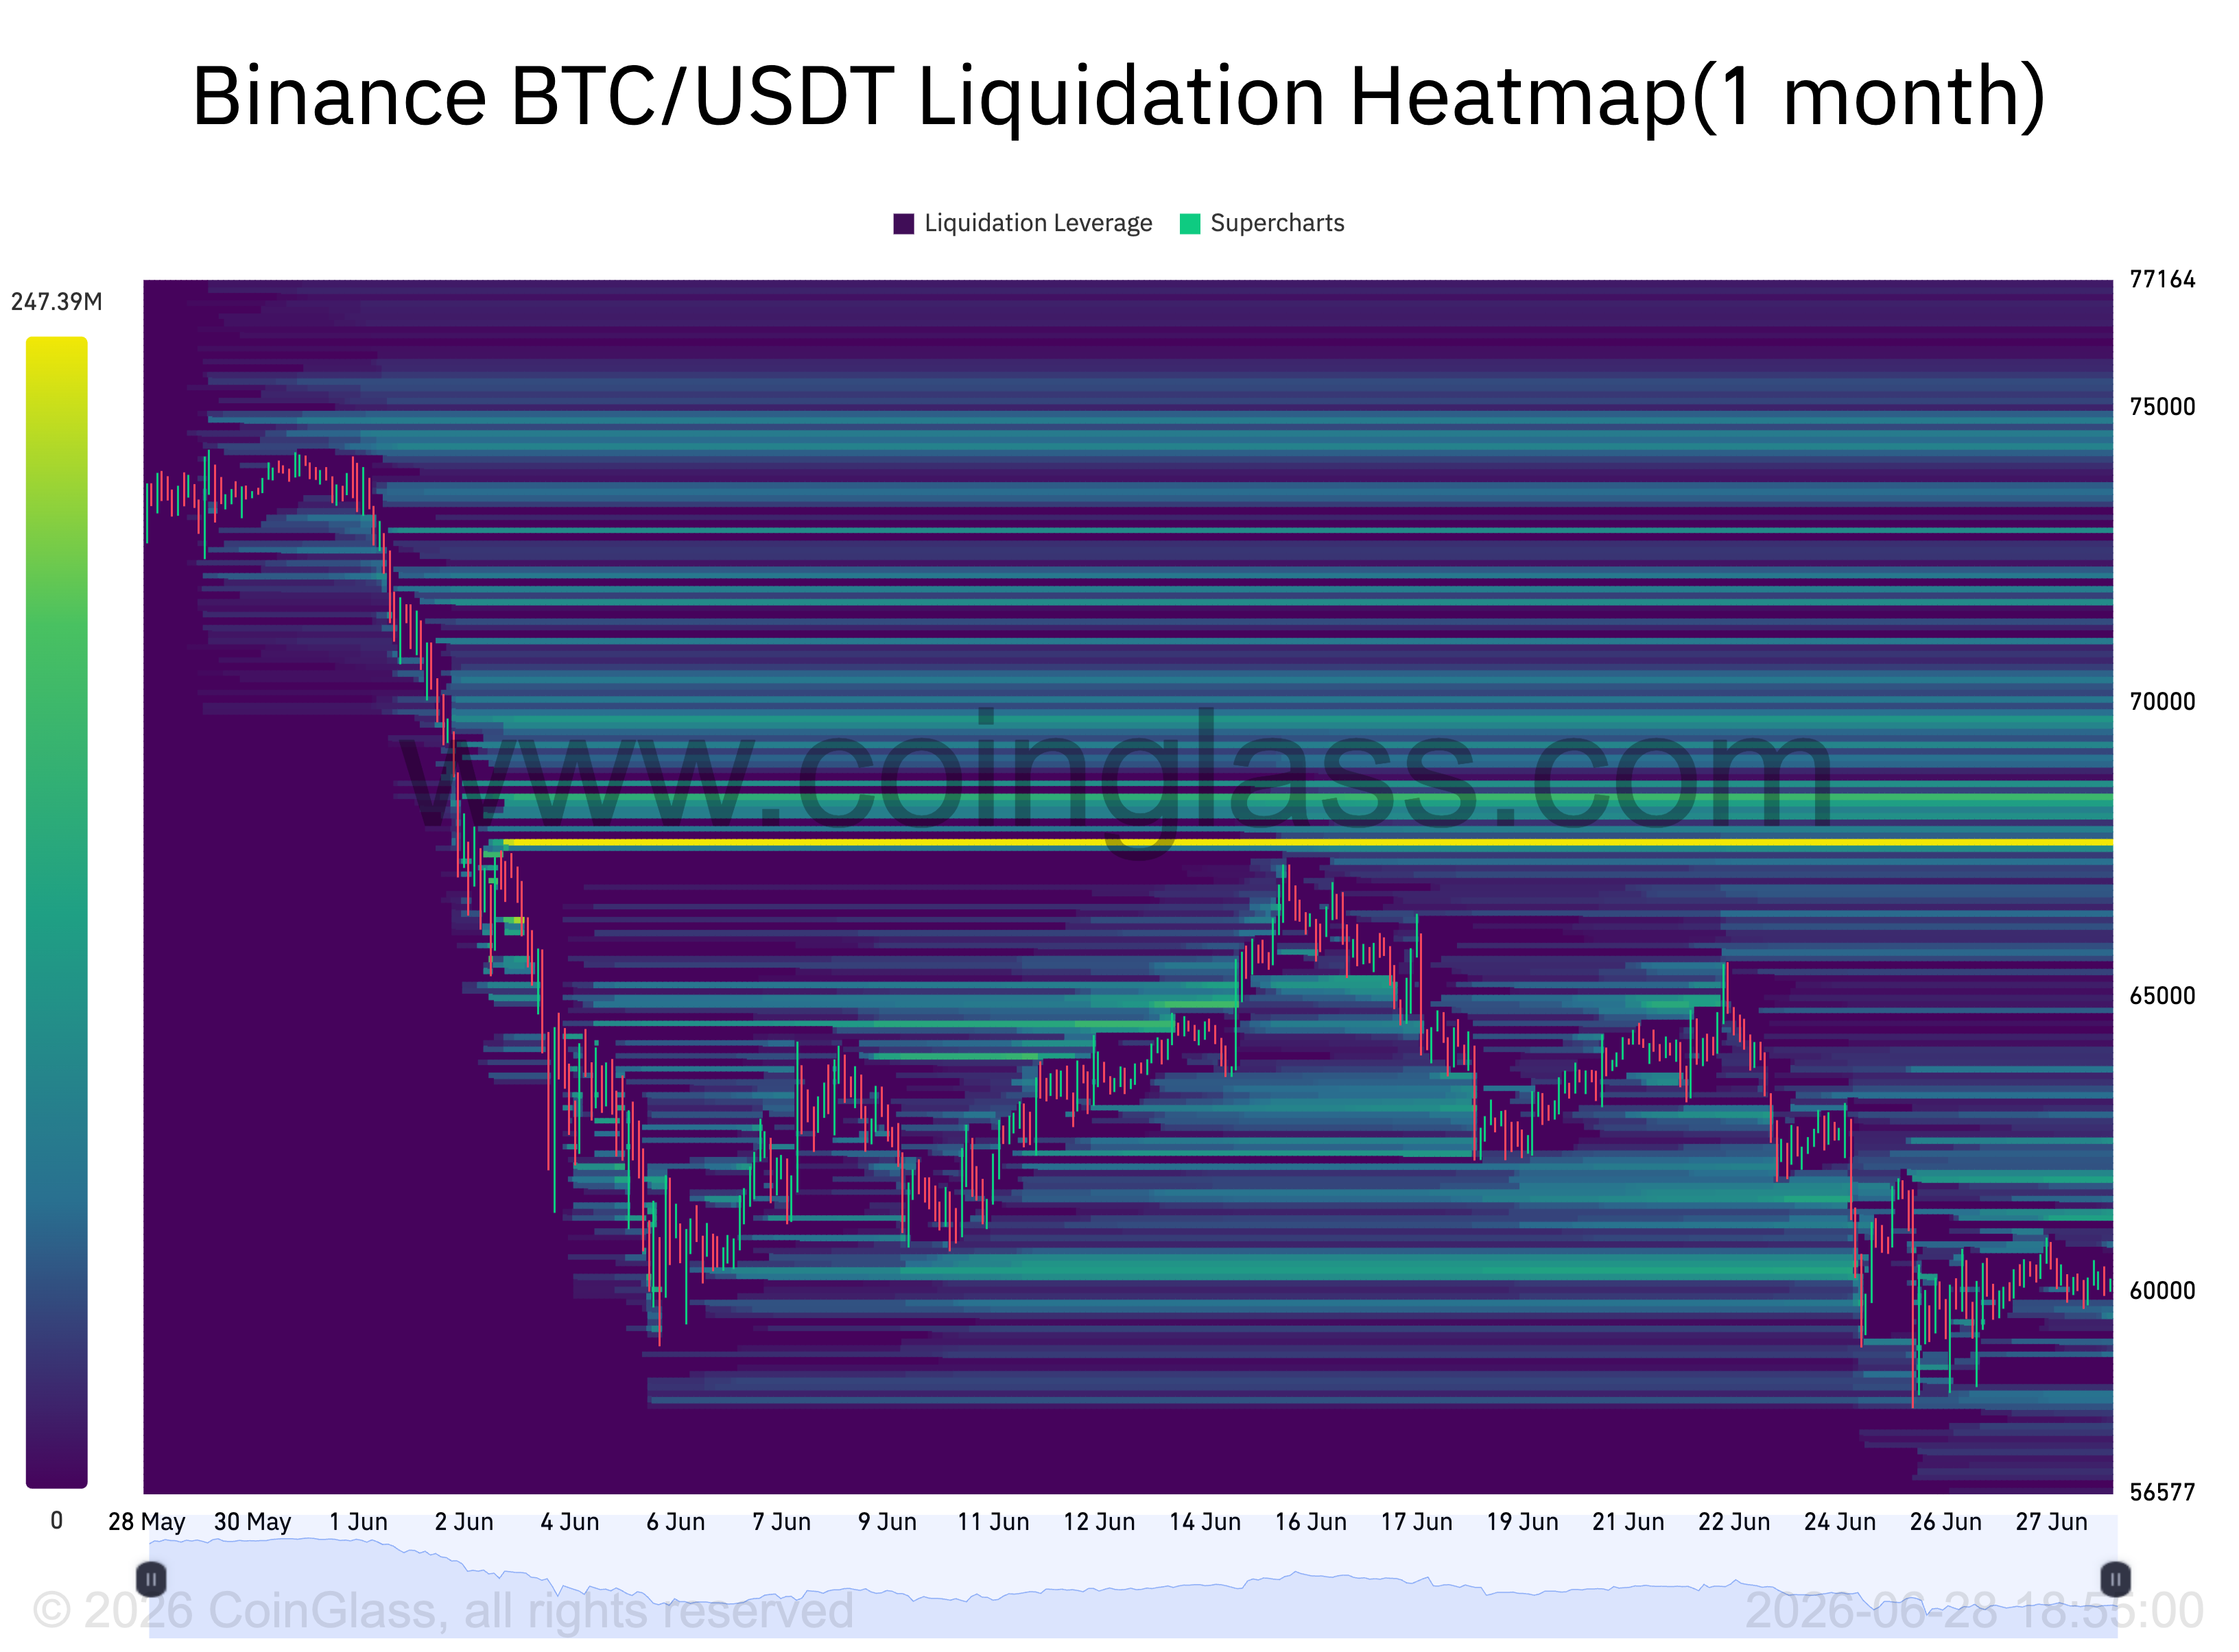
Binance BTC/USDT liquidation heatmap (1 month). Source: CoinGlass
For beginners, such clusters are often called “magnet zones.” When many leveraged positions are concentrated around the same price area, the market can move toward that zone because liquidations create forced buying or selling pressure.
In this case, significant liquidity sits above Bitcoin’s current price near $60,000.
If BTC rebounds and pushes toward $67,600, short sellers may be forced to close their positions. Since closing shorts requires buying Bitcoin back, that can add fresh upside pressure and fuel a short squeeze.
“I think $BTC bottoms here at 60k for now, targeting 75k to the upside before any chance of lower,” Fleh said in a Saturday post.
Bitcoin’s historical monthly returns also support Fleh’s bullish July outlook.
BTC has returned a 7.6% gain on average in July, making it one of its stronger months after a typically weaker June, which shows an average return of -1.40%, according to CoinGlass data highlighted by analyst CGT_Trader.
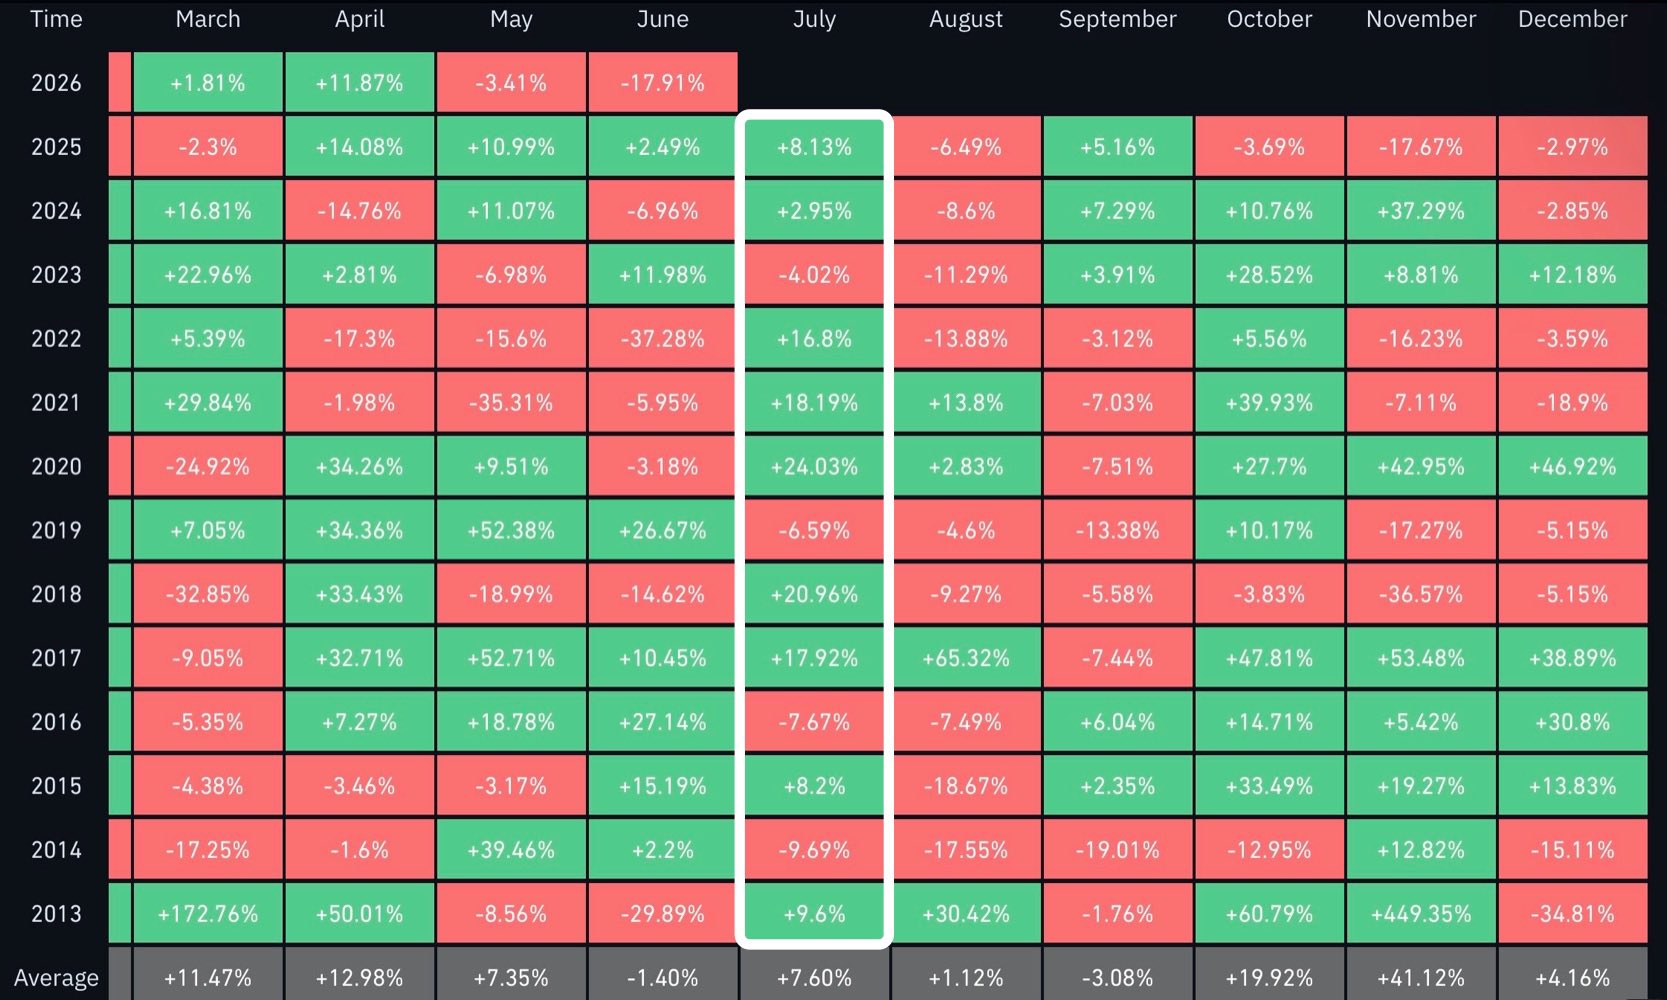
Bitcoin monthly returns tracking the July performance in since 2013. Source: CoinGlass/CGT_Trader
The trend has appeared even during bear market years.
For instance, Bitcoin rose 20.96% in July 2018 and 16.8% in July 2022. More recently, BTC gained 2.95% in July 2024 and 8.13% in July 2025, strengthening the case for another green month ahead.
A separate midterm-year seasonality chart also shows that- Bitcoin has averaged a 10.3% gain during the month, its strongest monthly return in such years.
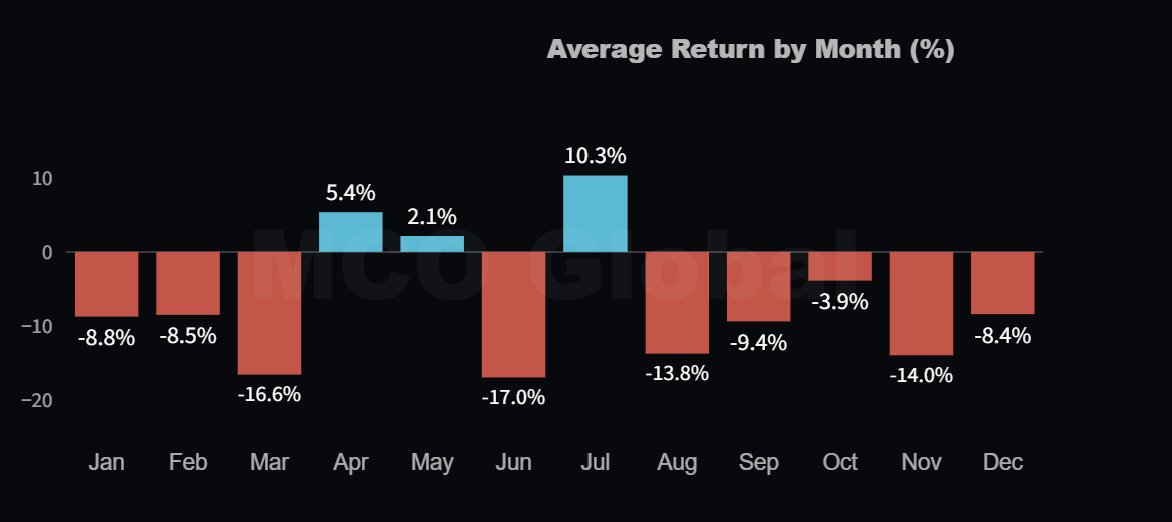
Bitcoin performance by month during US mid-term election years. Source: More Crypto Online
That compares with an average 17% loss in June, pointing to the possibility of a post-sell-off mean-reversion bounce.
Based on Bitcoin’s current price near $60,000, its historical July average return of 7.6% projects a move toward roughly $64,500, while the stronger midterm-year average of 10.3% points to about $66,100.
A repeat of Bitcoin’s bear-market July rebounds from 2022 and 2018 would put BTC between $70,000 and $72,500, while a 2020-style July rally would bring Fleh’s $75,000 target within reach.
Bitcoin’s ongoing drop below its 200-week simple moving average (200-day SMA, the blue line) near $62,445 raises the risk of further downside in July.
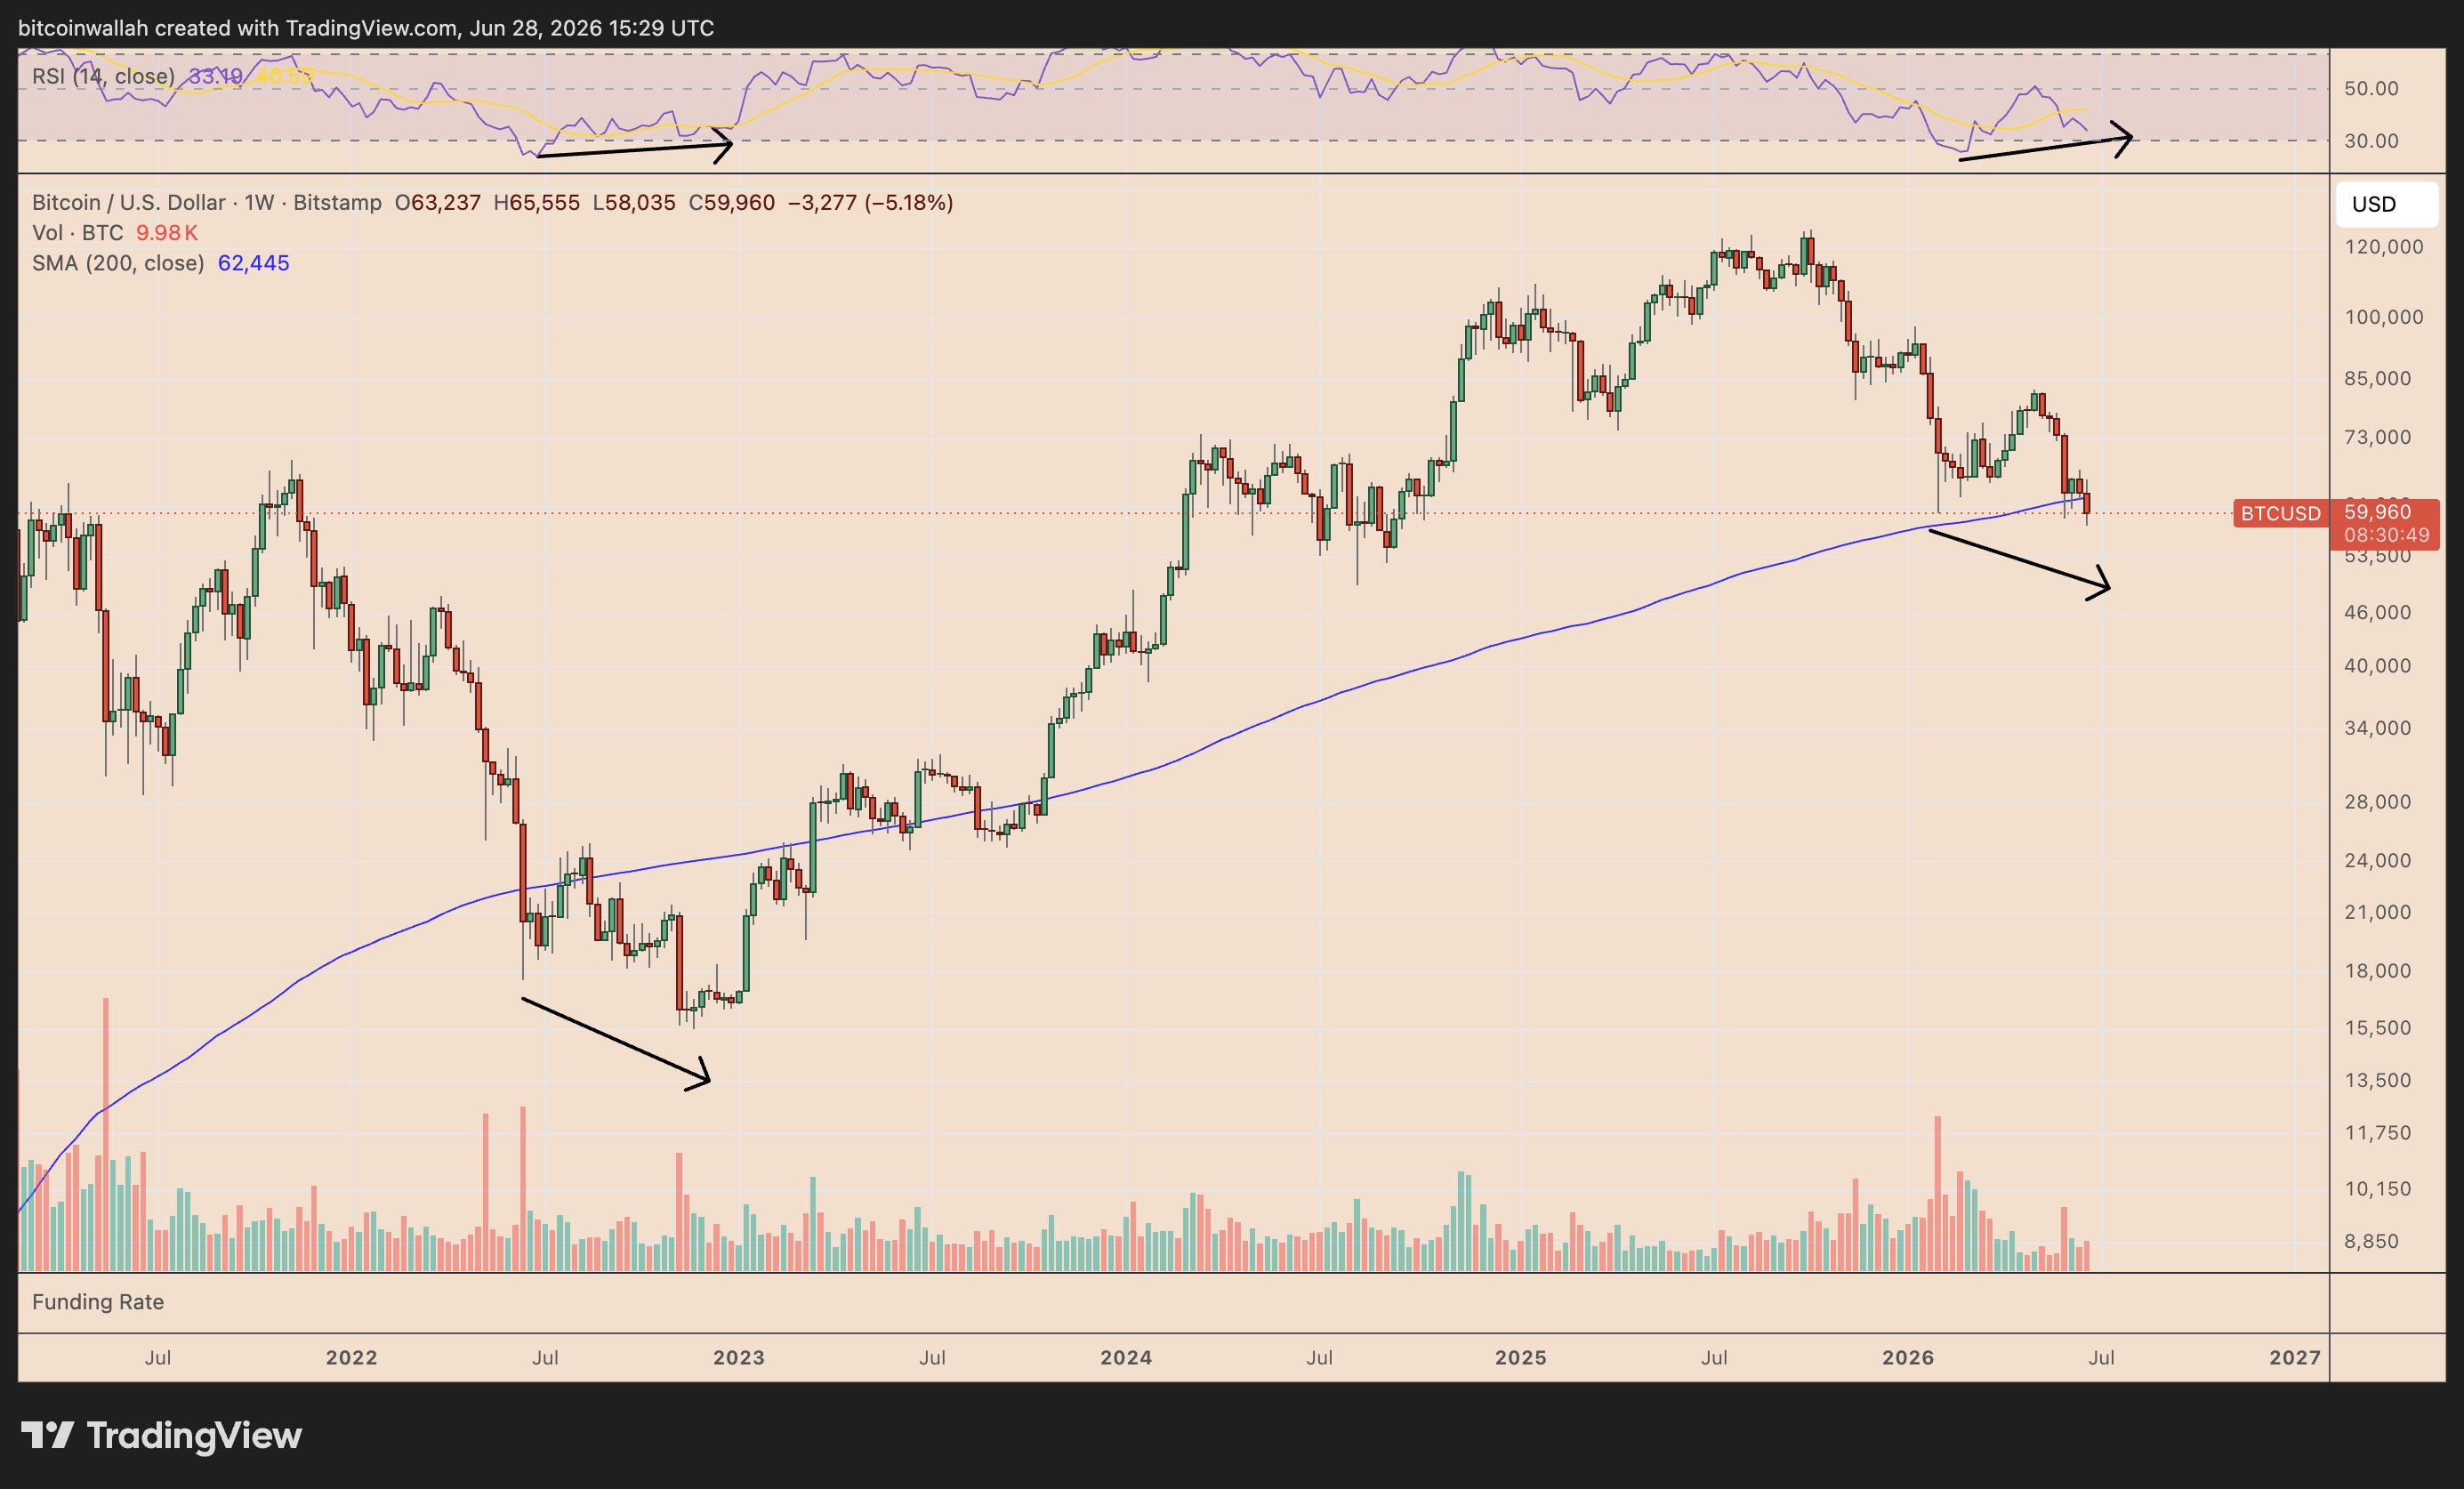
BTC/USD weekly chart. Source: TradingView
A similar loss of long-term moving-average support preceded deeper weakness during the 2022 bear market, when BTC continued lower before forming a bottom.
Related: Bitcoin faces fresh capitulation risk as 50K BTC moved at a loss
Bitcoin’s bear flag breakdown raises the odds of a price decline toward $55,000 in July unless BTC quickly reclaims the 200-day SMA.
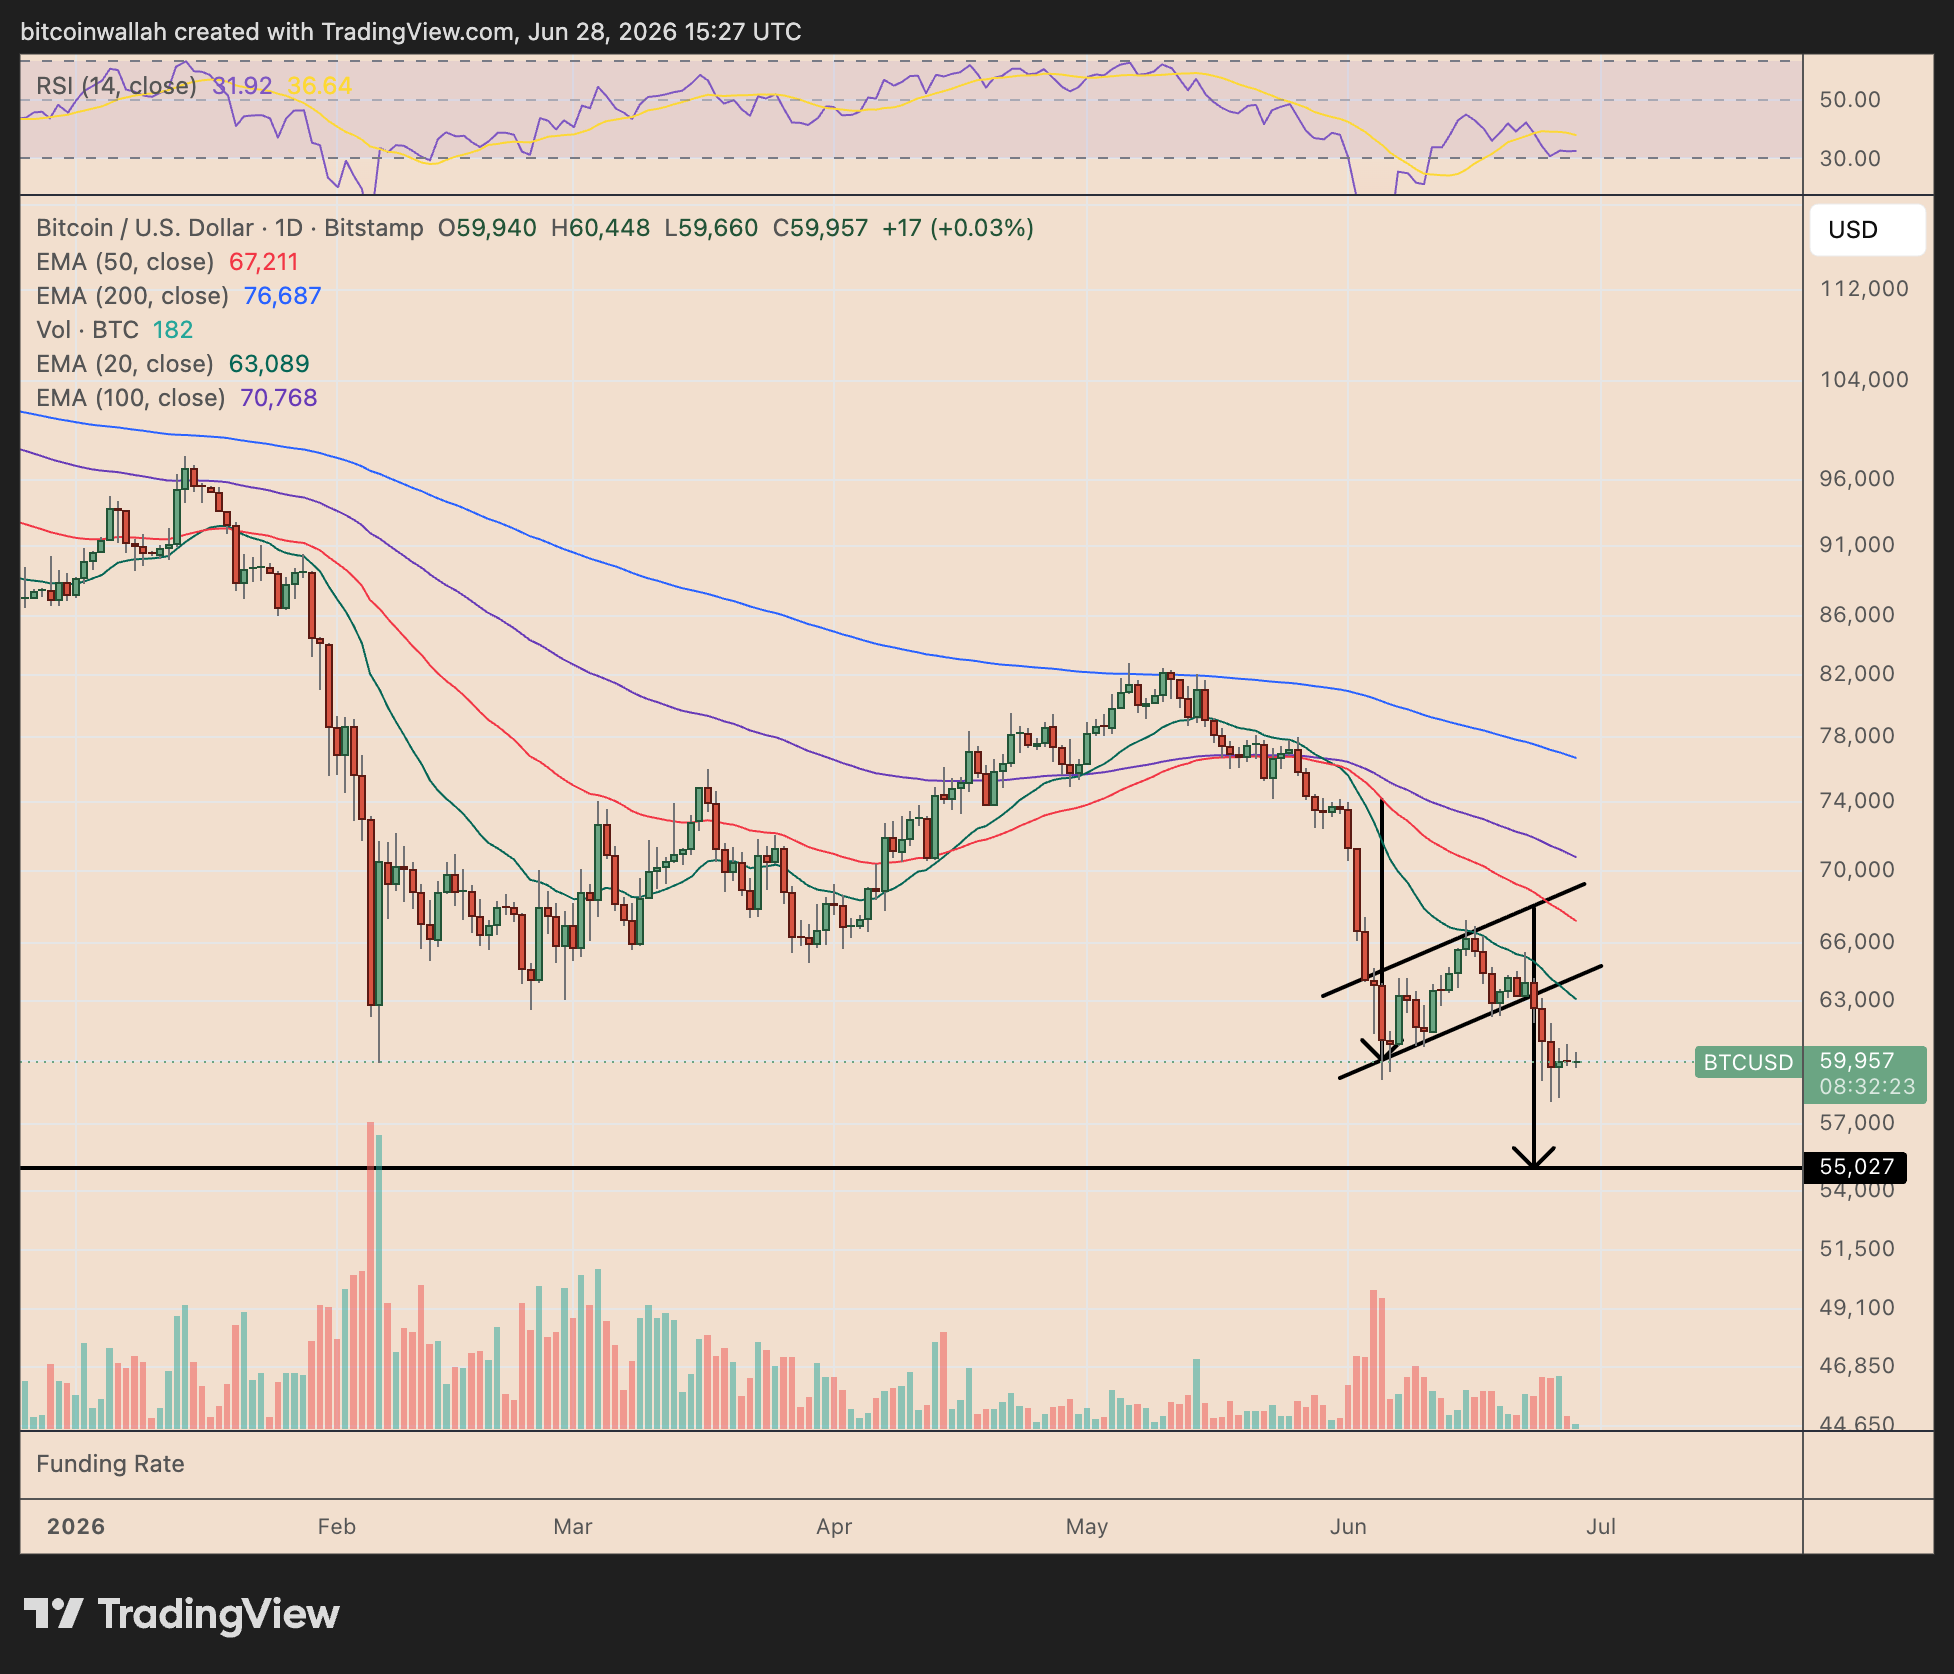
BTC/USD daily chart. Source: TradingView
This article is produced in accordance with Cointelegraph’s Editorial Policy and is intended for informational purposes only. It does not constitute investment advice or recommendations. All investments and trades carry risk; readers are encouraged to conduct independent research.
More on the subject
 Grayscale’s Pandl says Strategy should sell $3B Bitcoin to restore confidence<!–>[–>23 hours agoCointelegraph<!–>[–>
 Bitcoin UXTOs signal capitulation underway: Analyst<!–>[–>Jun 28, 2026Martin Young<!–>[–>
 Fidelity rebuts claims Bitcoin becomes less secure after halvings<!–>[–>Jun 27, 2026Sam BourgiGrayscale’s Pandl says Strategy should sell $3B Bitcoin to restore confidence<!–>[–>23 hours agoCointelegraph<!–>[–>Bitcoin UXTOs signal capitulation underway: Analyst<!–>[–>Jun 28, 2026Martin Young<!–>[–>Fidelity rebuts claims Bitcoin becomes less secure after halvings<!–>[–>Jun 27, 2026Sam Bourgi
U.S. President Donald Trump is reportedly withholding his signature from a sweeping housing bill that would bar the Federal Reserve from issuing…

Despite a disastrous week of capital flight across the broader cryptocurrency market, XRP exchange-traded funds (ETFs) managed to defy the trend.
Persistent inflation in Spain pressures ECB to hike rates, potentially impacting euro strength and crypto markets amid geopolitical tensions. The post Spanish…

The World Cup highlights the disparity between crypto hype and practical use, emphasizing the need for real-world applications over speculation. The post…