Money20/20 USA 2026: How Bitcoin, Stablecoins and AI Are Reshaping the Future of Finance
Bitcoin Magazine Money20/20 USA 2026: How Bitcoin, Stablecoins and AI Are Reshaping the Future of Finance From digital ownership to borderless value,…
Different assets on the market show uneven performance, which is not the best scenario for a longer-term recovery.
Original
U.Today
article
XRP, Zcash (ZEC), Ethereum (ETH) and Bitcoin (BTC) Price Analysis For August 11: Market Reaction Is Uneven
Tue, 11/08/2026 – 0:01
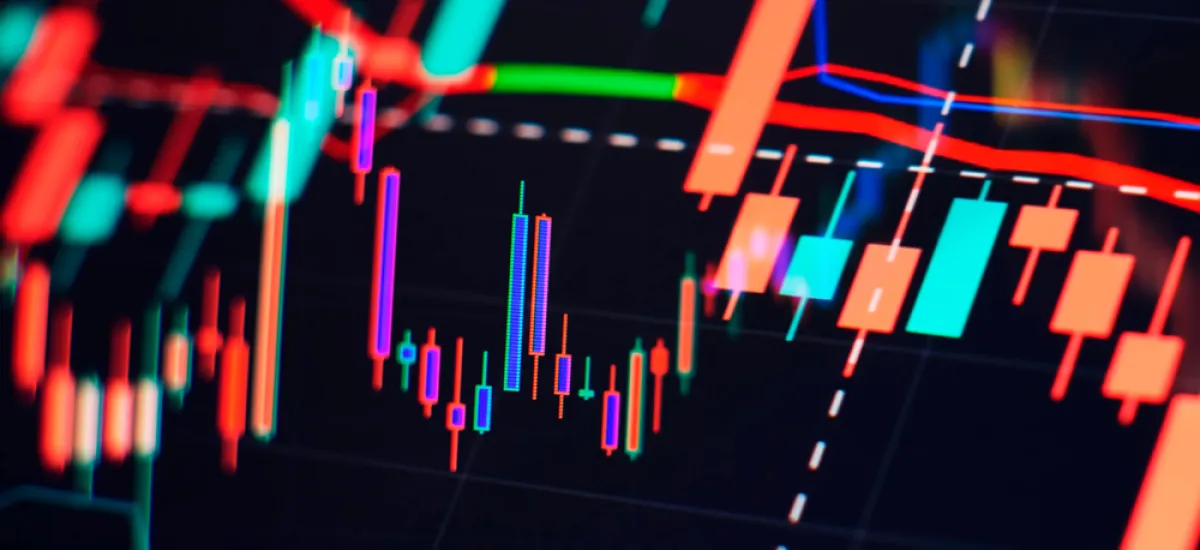
Different assets on the market show uneven performance, which is not the best scenario for a longer-term recovery.
Advertisement
Disclaimer: The opinions expressed by our writers are their own and do not represent the views of U.Today. The financial and market information provided on U.Today is intended for informational purposes only. U.Today is not liable for any financial losses incurred while trading cryptocurrencies. Conduct your own research by contacting financial experts before making any investment decisions. We believe that all content is accurate as of the date of publication, but certain offers mentioned may no longer be available.

Advertisement
With the most recent attempt at stabilization failing to result in a significant trend reversal, XRP is still trapped in a strong bearish structure. After moving sideways for the majority of July and the first part of August, the asset now trades at $1.03, perilously close to the psychologically significant $1 threshold.
The primary issue continues to be the moving-average structure. XRP is below each of the daily chart’s four averages. The shorter averages at roughly $1.07 and $1.09 provide immediate resistance, which is followed by much stronger resistance at roughly $1.18. At about $1.37, the long-term moving average is still significantly higher.

The general bearish setup is maintained by the negative slopes of all major averages. Sellers are also favored by momentum. The daily RSI is now below its signal average of 41.7, at about 38.3.
Bitcoin Miner Riot Secures Massive Deal With Anthropic
Since XRP is not yet significantly oversold, there may be more declines before momentum reaches a clear exhaustion point. As a result, the critical support zone is between $1.00 and $1.03. Losing it would expose $0.95 and $0.90 and eliminate the last remaining psychological support.
Advertisement
In order to recover, XRP must first recover $1.07–$1.09. A significant structural improvement would be represented by a move above $1.18.
Zcash’s technical picture is significantly better. Despite recent consolidation, ZEC is still above every significant moving average on the daily chart, trading at about $505. The closest dynamic support is located at about $497, and the moving averages are at about $481 and $469.

More significantly, the long-term average at $421 is still rising. As long as buyers protect the $469–$481 range, this alignment makes ZEC’s medium-term structure constructive. Rather than being overheated, momentum is neutral. The RSI is close to 52.6, just above its 49.5 signal line.
Advertisement
This allows ZEC to travel in any direction without the setup being hampered by an extreme momentum reading. Establishing a strong breakout above the $510–$520 range is the current challenge.
Recent candles indicate persistent reluctance in this area. Clearing it could reopen the $540–$560 range, where selling pressure was present during the previous July rally. After that, the next significant resistance is about $580. On the other hand, a decline below $469 would put the current bullish structure in jeopardy, while a loss of $497 would weaken the immediate setup.
ZEC is still technically superior to XRP for the time being. Although the price is above rising long-term support, buyers still need a breakout above $520 to resume significant upward momentum.
Although Ethereum is making an effort to create a recovery structure around $1,900, the daily chart still shows ETH at a significant technical barrier. The asset is trading close to $1,905, almost exactly in opposition to the moving average at $1,923, which has consistently constrained upside since the June collapse.

Since the June low of about $1,550, short-term conditions have significantly improved. Since then, ETH has experienced higher lows and recovered the shorter moving averages at roughly $1,877 and $1,806. The former now serves as immediate support, but if the current consolidation breaks downward, the $1,800–$1,805 range is a more crucial level.
Although it has recently flattened, the RSI is currently at 54.8, above the neutral 50 level. This is consistent with price action: buyers are still in some control, but they have not created enough momentum to cause a breakout.
A daily close above $1,923–$1,950 is the first prerequisite. The psychological $2,000 level and, eventually, the long-term moving average around $2,143 could be reached if this area is cleared. Until then, ETH is still attempting to recover within a much more expansive bearish structure.
With increasingly compressed price action, Bitcoin is still consolidating around $64,800, indicating that the market is getting close to making another directional decision. After rising from roughly $58,000, Bitcoin has been able to maintain a relatively stable support structure by staying above its shorter moving averages around $64,239 and $63,343.

Additionally, the RSI at 53.9 is still somewhat bullish without getting close to overbought territory. The overhead resistance is the issue. The $66,000–$67,000 range is the current barrier for Bitcoin since it is still below the falling moving average at $66,817.
The much stronger long-term average, at about $72,192, is located above that. The recovery would be strengthened and $70,000–$72,200 might be back in play with a strong break above $66,800.
But losing $63,300 would expose $60,000, followed by the June bottom at about $58,000, undermining the current higher-low structure. Bitcoin is not yet confirming a bullish reversal or breaking down. The larger trend will be limited until Bitcoin can firmly reclaim $66,800 and start challenging the $72,000 area, even though short-term momentum has recovered.
#XRP
#Zcash
#Ethereum
#Hyperliquid
Advertisement
News
Aug 11, 2026 – 6:20
Bitcoin Miner Riot Secures Massive Deal With Anthropic
News
Aug 10, 2026 – 20:57
Bitwise CIO: Bitcoin to End Year ‘Significantly Higher’
Advertisement
Advertisement
Advertisement
Latest Press releases
CT3 Begins Preparing Its Ecosystem for the Launch of the CT3GB Economy
Syntetika Launches Tokenization Hub Bringing Regulated Investment Strategies Onchain
Carbon Launches TradFi-Native On-Chain Derivatives Venue With 950+ Markets in One Account
Subscribe to daily newsletter
Subscribe
Interviews
Aug 3, 2026 – 9:00
Crypto Swap Infrastructure Explained by SwapSpace and SimpleSwap After Five Years of Partnership

U.Today Editorial Team
Reviews
Jul 31, 2026 – 12:16
UKey Seed Ring Review: A Wearable Redefining Crypto Self-Custody

Dan Burgin
Reviews
Jul 20, 2026 – 9:00
Bitget Stocks 2.0 Review: Can Crypto Exchange Replace Stock Brokerage?
Dan Burgin
Reviews
Jul 17, 2026 – 16:51
Gate Prediction Market Review: Bringing Prediction Markets to the Mainstream in the Wake of World Cup
Dan Burgin
Reviews
Jul 8, 2026 – 9:34
TronBid Review: A Transparent Marketplace for Renting TRON Energy at Lower Cost
Dan Burgin
Price Index
Bitcoin (BTC) Price Index
Ethereum (ETH) Price Index
XRP Price Index
Cardano (ADA) Price Index
Dogecoin (DOGE) Price Index
Shiba Inu (SHIB) Price Index
Tron (TRX) Price Index
Polygon (POL) Price Index
Litecoin (LTC) Price Index
Solana (SOL) Price Index
Zcash (ZEC) Price Index
Hyperliquid (HYPE) Price Index
Show all
Our social media
There’s a lot to see there, too
News
Aug 11, 2026 – 6:20
Bitcoin Miner Riot Secures Massive Deal With Anthropic
Bitcoin News
Alex Dovbnya
Price Analysis
Aug 11, 2026 – 0:01
XRP, Zcash (ZEC), Ethereum (ETH) and Bitcoin (BTC) Price Analysis For August 11: Market Reaction Is Uneven
XRP Zcash Ethereum Hyperliquid
Arman Shirinyan
News
Aug 10, 2026 – 20:57
Bitwise CIO: Bitcoin to End Year ‘Significantly Higher’
Bitcoin Price Prediction Bitwise
Alex Dovbnya
Advertisement

Thank you. We’ll contact you shortly.
Ok
Bitcoin Magazine Money20/20 USA 2026: How Bitcoin, Stablecoins and AI Are Reshaping the Future of Finance From digital ownership to borderless value,…
Managing your crypto taxes can become increasingly complicated as your activity starts spreading across multiple exchanges, wallets, blockchains, and DeFi protocols. CoinTracking…

Here's how investors are rapidly changing the way they seek exposure to major assets.

Eight of 13 cash sessions fell from September 21–October 7, 2026, but boundary checks and opposing ETF flows leave sustained institutional selling…